Agent Mode
Agent Mode enables the LLM to autonomously explore and modify your codebase using built-in tools. Instead of relying solely on the context you provide, the agent can investigate your project on-demand—reading files, listing directories, searching for patterns, and even making changes to help you develop faster.
How Agent Mode Works
When Agent Mode is enabled, the LLM gains access to a set of built-in tools that allow it to explore and modify your project dynamically:
Read Tools
| Tool | Description |
|---|---|
read_file | Read the contents of a file in the project |
list_files | List files and directories (with optional recursion) |
search_files | Search for regex patterns across project files |
fetch_page | Fetch a web page by URL and return its readable text content (HTML/CSS/JS stripped) |
PSI Tools (Code Intelligence)
| Tool | Description |
|---|---|
find_symbols | Search for symbol definitions (classes, methods, fields) by name across the project |
document_symbols | List all symbol definitions in a file with their kind and line numbers |
find_references | Find all usages of a symbol using semantic reference search |
find_definition | Navigate from a symbol usage to its definition |
find_implementations | Find all implementations of an interface, abstract class, or method |
find_callees | List the methods a given method calls (outgoing edges — the inverse of find_references) |
trace_call_chains | Trace caller→callee (or callee→caller) chains between methods, depth-bounded |
calculate_complexity | Compute cyclomatic complexity per method and flag methods over a threshold |
find_dead_code | Report unreferenced symbols as heuristic dead-code candidates (require human confirmation) |
Write Tools
| Tool | Description |
|---|---|
write_file | Create new files with the specified content |
edit_file | Modify existing files by replacing text |
run_command | Execute terminal commands in the project directory (30s timeout) |
run_tests | Auto-detect build system and run tests with structured results (configurable timeout) |
As you chat with the LLM, it decides when to use these tools. For exploration tasks, the agent might search, list, and read files to understand your codebase. The fetch_page tool lets the agent read external documentation, API references, or web pages to gather additional context. The PSI tools give the agent IDE-level code intelligence — it can find symbol definitions, look up references, navigate to definitions, and discover implementations, all powered by IntelliJ's semantic index rather than text search. For development tasks, it can create new files, edit existing code, run commands, or run tests to verify changes.
Per-Tool Enable/Disable
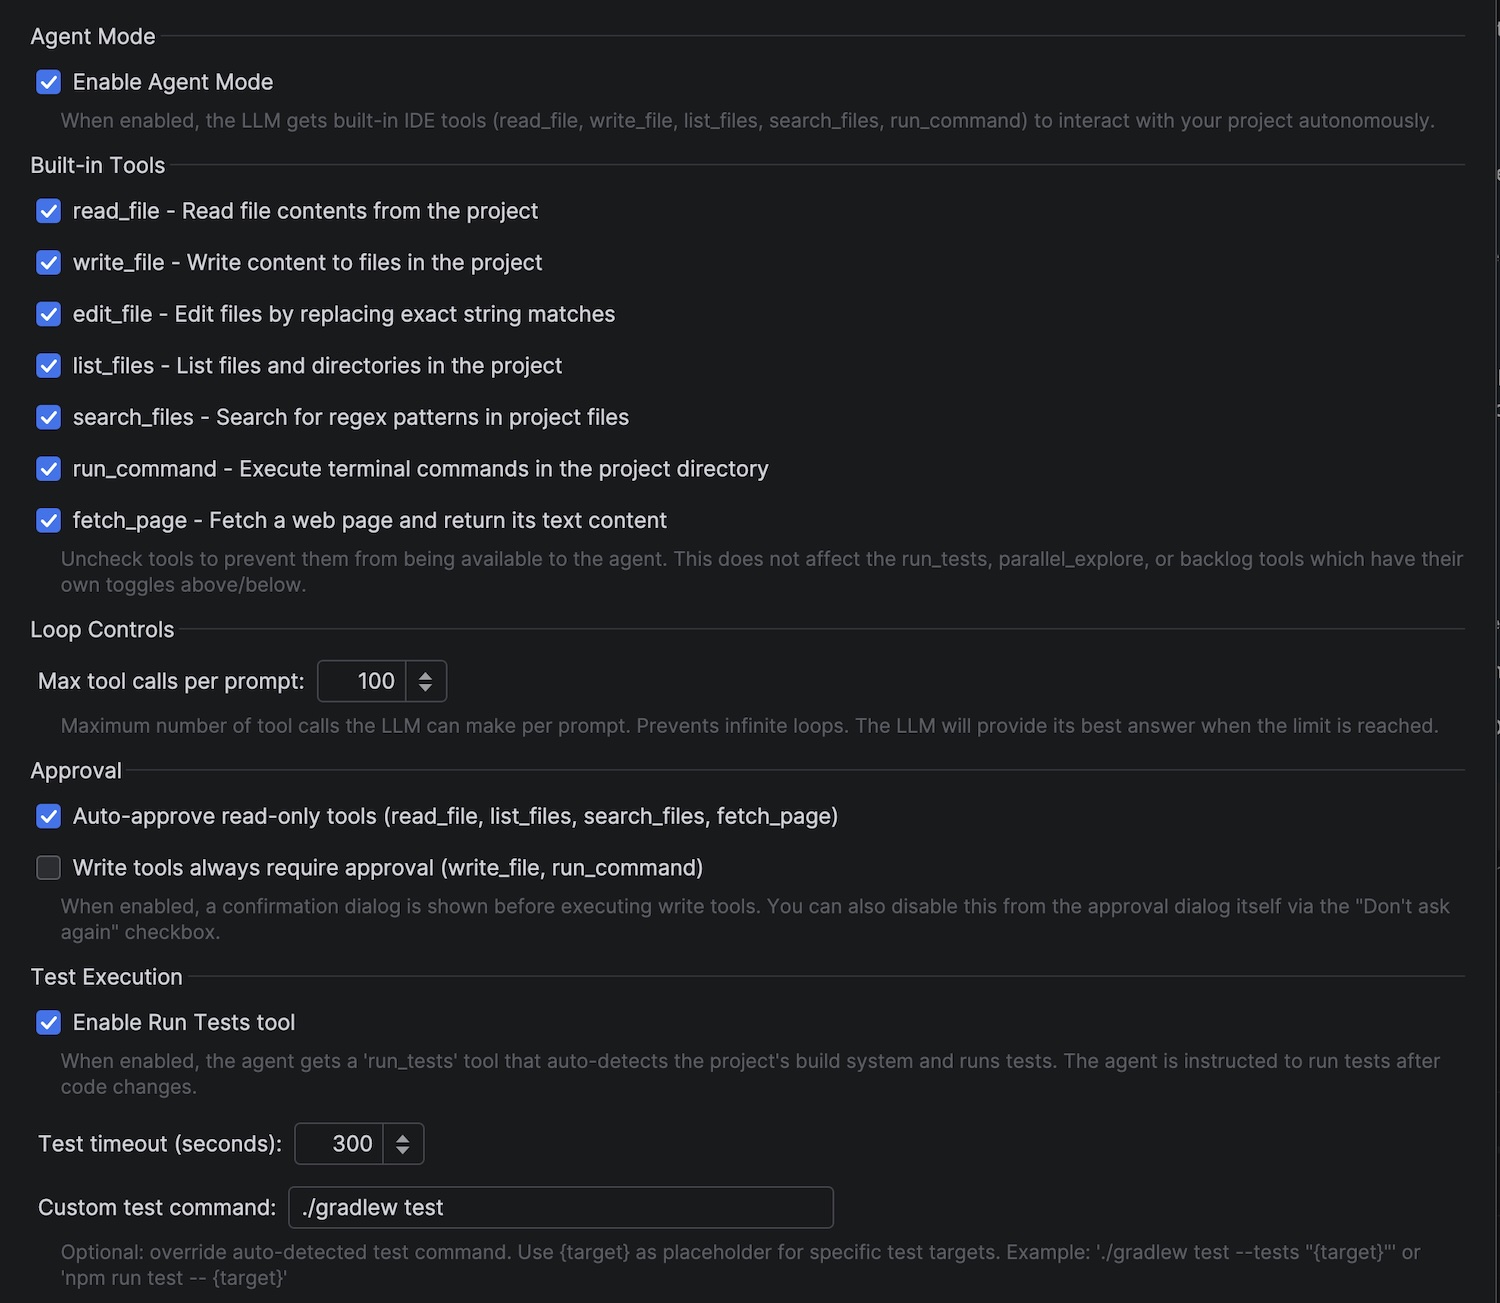
Each built-in tool can be individually enabled or disabled in the Built-in Tools section of the Agent settings. Uncheck a tool to prevent the agent from using it. This is useful when you want to:
- Restrict capabilities — disable
run_commandto prevent terminal access, orfetch_pageto block web access - Reduce context window usage — each enabled tool adds its specification to the LLM prompt, consuming tokens. Disabling tools you don't need frees up context for your actual conversation, which is especially important with smaller context window models
The run_tests, parallel_explore, and backlog tools have their own dedicated toggles in separate settings sections.
Write operations require user approval by default. You'll see a diff preview before any changes are applied to your project.
Getting Started
1. Enable Agent Mode
Go to Settings > Tools > DevoxxGenie > Agent and enable:
- Enable Agent Mode (required)
2. Start Chatting
Once enabled, simply ask the LLM questions about your codebase. The agent will automatically use tools when needed to investigate:
- "How does the database connection work in this project?"
- "Find where the user authentication is implemented"
- "Explain the project structure and main components"
Agent mode works best for exploratory questions where the LLM needs to discover information across multiple files. For simple questions with provided context, regular chat mode may be more efficient.
Automated Test Execution
The run_tests tool gives the agent the ability to run your project's tests and inspect the results. After modifying code with write_file or edit_file, the agent automatically runs relevant tests, analyzes any failures, fixes the code, and re-runs until the tests pass.
Build System Auto-Detection
The tool automatically detects your project's build system by looking for configuration files in the project root:
| Build System | Detected By | Test Command |
|---|---|---|
| Gradle | build.gradle or build.gradle.kts | ./gradlew test |
| Maven | pom.xml | mvn test |
| npm | package.json | npm test |
| Cargo | Cargo.toml | cargo test |
| Go | go.mod | go test ./... |
| Make | Makefile | make test |
The agent can also target specific tests (e.g., a single class or method) by passing a test_target parameter, which is translated into the appropriate flag for each build system.
Structured Results
Unlike run_command, the run_tests tool parses test output and returns structured results to the LLM:
- Status: PASSED, FAILED, ERROR, or TIMEOUT
- Counts: tests run, passed, failed, skipped
- Failed test names: extracted from the output for targeted debugging
- Raw output: included on failure so the agent can diagnose the issue
Custom Test Command
If auto-detection doesn't fit your project, you can set a custom test command in Settings > Tools > DevoxxGenie > Agent > Test Execution. Use {target} as a placeholder for specific test targets:
./gradlew test --tests "{target}"
npm run test -- {target}
Ask the agent to write tests first, then implement the code:
"Write a unit test for a reverseString method in StringUtils, then implement the method and run the tests to verify it works."
The agent will create the test, write the implementation, call run_tests, and iterate until everything passes.
PSI Tools (Code Intelligence)
PSI (Program Structure Interface) tools give the agent access to IntelliJ's semantic code index. Unlike text-based search (search_files), PSI tools understand language semantics — imports, type hierarchies, qualified names, and cross-file references. They work across all languages supported by your IDE (Java, Kotlin, Python, JavaScript/TypeScript, Go, Rust, and more).
Available PSI Tools
find_symbols
Search for symbol definitions by name across the entire project. Only returns actual declarations (classes, methods, fields), not usages. Supports an optional kind filter (class, method, or field).
Example prompt: "Find where the ChatService class is defined"
document_symbols
List all symbol definitions in a file with their kind, name, and line number. Shows nesting structure (e.g., methods inside classes). Useful for understanding file structure before reading specific sections.
Example prompt: "Show me the structure of PromptExecutionService.java"
find_references
Find all usages of a symbol defined at a given file and line. More accurate than text search because it understands imports, qualified names, and language semantics.
Example prompt: "Find all places where executeQuery is called"
find_definition
Navigate from a symbol usage to its definition. Given a file position where a symbol is used, resolves and returns the location where it is defined. Understands imports, inheritance, and cross-file references.
Example prompt: "Go to the definition of the ChatModelFactory interface used in this file"
find_implementations
Find all implementations of an interface, abstract class, or abstract method. Useful for understanding the type hierarchy and finding concrete implementations.
Example prompt: "Find all implementations of ChatModelFactory"
find_callees
List the methods a given method calls — the outgoing edges of the call graph, and the inverse of find_references. Each call target is resolved through the semantic index, so overloads and inheritance are understood (more accurate than grepping the method body). Java in v1; other languages return a clear "not supported" message.
Example prompt: "What methods does executeQuery call?"
trace_call_chains
Trace call chains from a start method, walking caller→callee or callee→caller edges up to a bounded depth, and return the path(s). Answers "how does execution reach X" or "what chain of calls does X trigger" — questions a single find_references/find_callees call can't. Bounded in depth (default 5, max 10) and number of paths. Java in v1.
Example prompt: "Trace how a user prompt reaches the streaming executor"
calculate_complexity
Compute cyclomatic (McCabe) complexity per Java method by counting decision points (if/for/while/case/catch/&&/||/ternary), flagging methods over a configurable threshold (default 10). Useful for finding the riskiest methods to refactor or test.
Example prompt: "Which methods in PromptExecutionService are the most complex?"
find_dead_code
Report symbols in a file with zero project-scope references as heuristic dead-code candidates — never certainties. Reflection, serialization, dependency injection, and out-of-project callers are invisible to reference search, so every result requires human confirmation. Conservatively excludes public members, constructors/main, @Override and any annotated member, and serialization members to keep false positives low. Java in v1.
Example prompt: "Are there any unused private methods in this file?"
Why PSI Tools Matter
With PSI tools, the agent can navigate your codebase the same way you do in the IDE — jumping to definitions, finding usages, and exploring type hierarchies. This is significantly more accurate than text-based grep for tasks like:
- Understanding how components are wired together
- Tracing call chains across files
- Finding all concrete implementations of an interface
- Identifying where a method is called before refactoring it
Enabling PSI Tools
PSI tools are enabled by default. In Settings > Tools > DevoxxGenie > Agent > PSI Tools (Code Intelligence) you can:
- Turn the master "Enable PSI Tools" toggle off to disable the entire group at once.
- Leave the master toggle on and uncheck individual tools to hide only specific tools from the agent, while keeping the rest active.
PSI tools are read-only and don't require user approval. They are also available to parallel sub-agents for deeper exploration.
PSI tools (including the call-graph tools) operate on IntelliJ's live semantic index, so they are most accurate for languages your IDE indexes — and find_callees, trace_call_chains, calculate_complexity, and find_dead_code are Java-only in v1. If you need a cross-language code graph for polyglot or non-indexed repositories (or a web graph visualization), you can run CodeGraphContext as an external MCP server and point DevoxxGenie's MCP client at it — no migration required. For the indexed project itself, the built-in PSI tools are preferred: they ride a live, language-aware index rather than a separately-maintained graph DB.
Parallel Sub-Agents
Parallel Sub-Agents extend Agent Mode by spawning multiple read-only AI assistants that concurrently investigate different aspects of your project. This is especially useful for large codebases where you need to understand multiple components at once.
When the LLM decides it needs to investigate multiple areas simultaneously, it can invoke the parallel_explore tool with a list of exploration queries. Each query is assigned to an independent sub-agent that runs in parallel.
Each sub-agent:
- Has read-only access to your project (read_file, list_files, search_files, fetch_page only)
- Runs with its own isolated chat memory and tool call budget
- Can use a different LLM provider/model than the main agent (e.g., a cheaper/faster model)
- Returns a concise markdown summary of its findings back to the main agent
The main agent then synthesizes all sub-agent results into a unified response.
Configuration
All agent settings are in Settings > Tools > DevoxxGenie > Agent.
Agent Mode Settings
| Setting | Default | Description |
|---|---|---|
| Enable Agent Mode | Disabled | Enables the agent with full tool access (read, write, and execute) |
| Built-in Tools | All enabled | Per-tool checkboxes to enable/disable individual tools (read_file, write_file, edit_file, list_files, search_files, run_command, fetch_page) |
| Enable Debug Logs | Disabled | Adds detailed logging of tool arguments and results |
PSI Tools Settings
| Setting | Default | Description |
|---|---|---|
| Enable PSI Tools | Enabled | Master toggle — enables the entire group of IDE-powered code intelligence tools. Turning this off disables all PSI tools regardless of the per-tool settings below. |
↳ find_symbols | Enabled | Search for symbol definitions by name |
↳ document_symbols | Enabled | List the symbol structure of a file |
↳ find_references | Enabled | Find all usages of a symbol |
↳ find_definition | Enabled | Navigate from a usage to its definition |
↳ find_implementations | Enabled | Find implementations of an interface or abstract class |
↳ find_callees | Enabled | List the methods a given method calls (Java) |
↳ trace_call_chains | Enabled | Trace caller/callee call chains between methods (Java) |
↳ calculate_complexity | Enabled | Compute cyclomatic complexity of Java methods |
↳ find_dead_code | Enabled | Report unreferenced symbols as heuristic dead-code candidates (Java) |
Individual per-tool checkboxes are greyed out when the master toggle is off, so your per-tool preferences are preserved when you re-enable the group.
Test Execution Settings
| Setting | Default | Range | Description |
|---|---|---|---|
| Enable Run Tests tool | Enabled | On/Off | Enables or disables the run_tests tool |
| Test timeout | 300s | 10-600s | Maximum time a test run can take before being stopped |
| Custom test command | (empty) | — | Override auto-detected test command. Use {target} for specific test targets |
Parallel Exploration Settings
| Setting | Default | Range | Description |
|---|---|---|---|
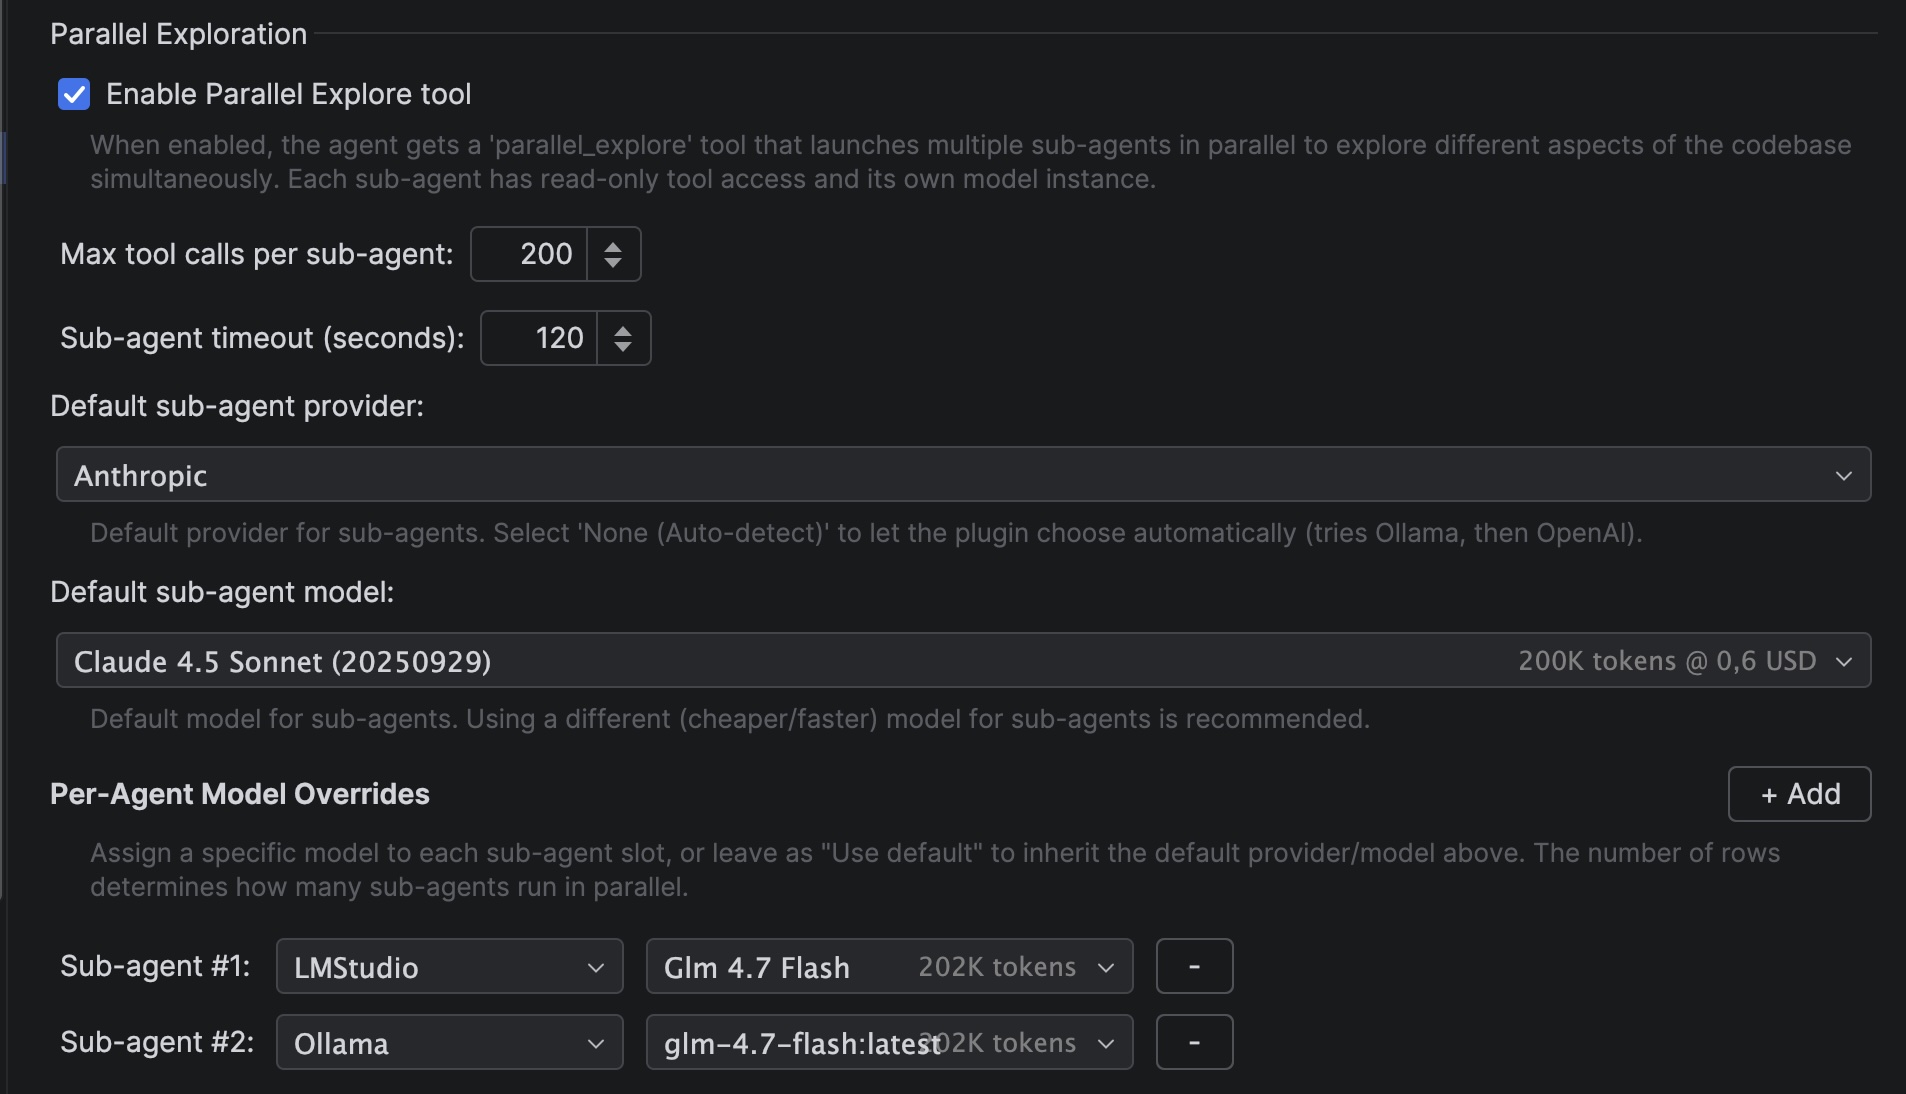
| Enable Parallel Explore tool | Enabled | On/Off | Enables or disables the parallel_explore tool |
| Max tool calls per sub-agent | 200 | 1-200 | How many file reads/searches each sub-agent can perform |
| Sub-agent timeout | 120s | 10-600s | Maximum time each sub-agent can run before being stopped |
The number of concurrent sub-agents is determined by the number of rows in the Per-Agent Model Overrides section below (up to 10). There is no separate parallelism spinner — simply add or remove sub-agent rows to control parallelism.
Default Sub-Agent Model
You can configure a default provider and model for all sub-agents. This is separate from the main agent's model, allowing you to use a cheaper or faster model for exploration tasks.
- Default sub-agent provider: Select a provider or choose "None (Auto-detect)" to let the plugin choose automatically (tries Ollama first, then OpenAI)
- Default sub-agent model: Select the model to use with the chosen provider
Using a smaller, faster model (e.g., gpt-4o-mini, qwen2.5:7b, gemini-flash, or glm-4.7-flash via Ollama) for sub-agents can significantly reduce costs while maintaining good exploration quality. Sub-agents only need to read and summarize code, not generate complex implementations.
For the main agent coordinator, glm-4.7-flash via Ollama is a very powerful local option that provides excellent reasoning capabilities for orchestrating tool calls and coordinating sub-agents.
Per-Agent Model Overrides
You can dynamically add and remove sub-agent slots using the "+ Add" and "-" buttons. The number of rows directly controls how many sub-agents can run in parallel (from 1 to 10). Each row lets you select a different provider/model, or leave it as "Use default" to inherit the default sub-agent model.
- Click "+ Add" to add a new sub-agent slot (up to 10)
- Click "-" on any row to remove that sub-agent slot (minimum 1 must remain)
- Row labels automatically re-number when a row is removed
This enables scenarios like:
- Sub-agent #1: Uses a powerful model for complex analysis
- Sub-agent #2: Uses a fast local model for simple file scanning
- Sub-agent #3: Uses a different cloud provider for cost balancing
Triggering Parallel Sub-Agents
When Agent Mode is enabled, the Enable Parallel Explore tool option (enabled by default) allows the LLM to spawn sub-agents automatically. Here are example prompts that trigger parallel exploration:
- "Explore this codebase and explain the architecture"
- "Investigate how authentication, database access, and API routing work in this project"
- "Find all REST endpoints, their request/response types, and the service classes they call"
- "Analyze the error handling patterns, logging strategy, and test coverage in this project"
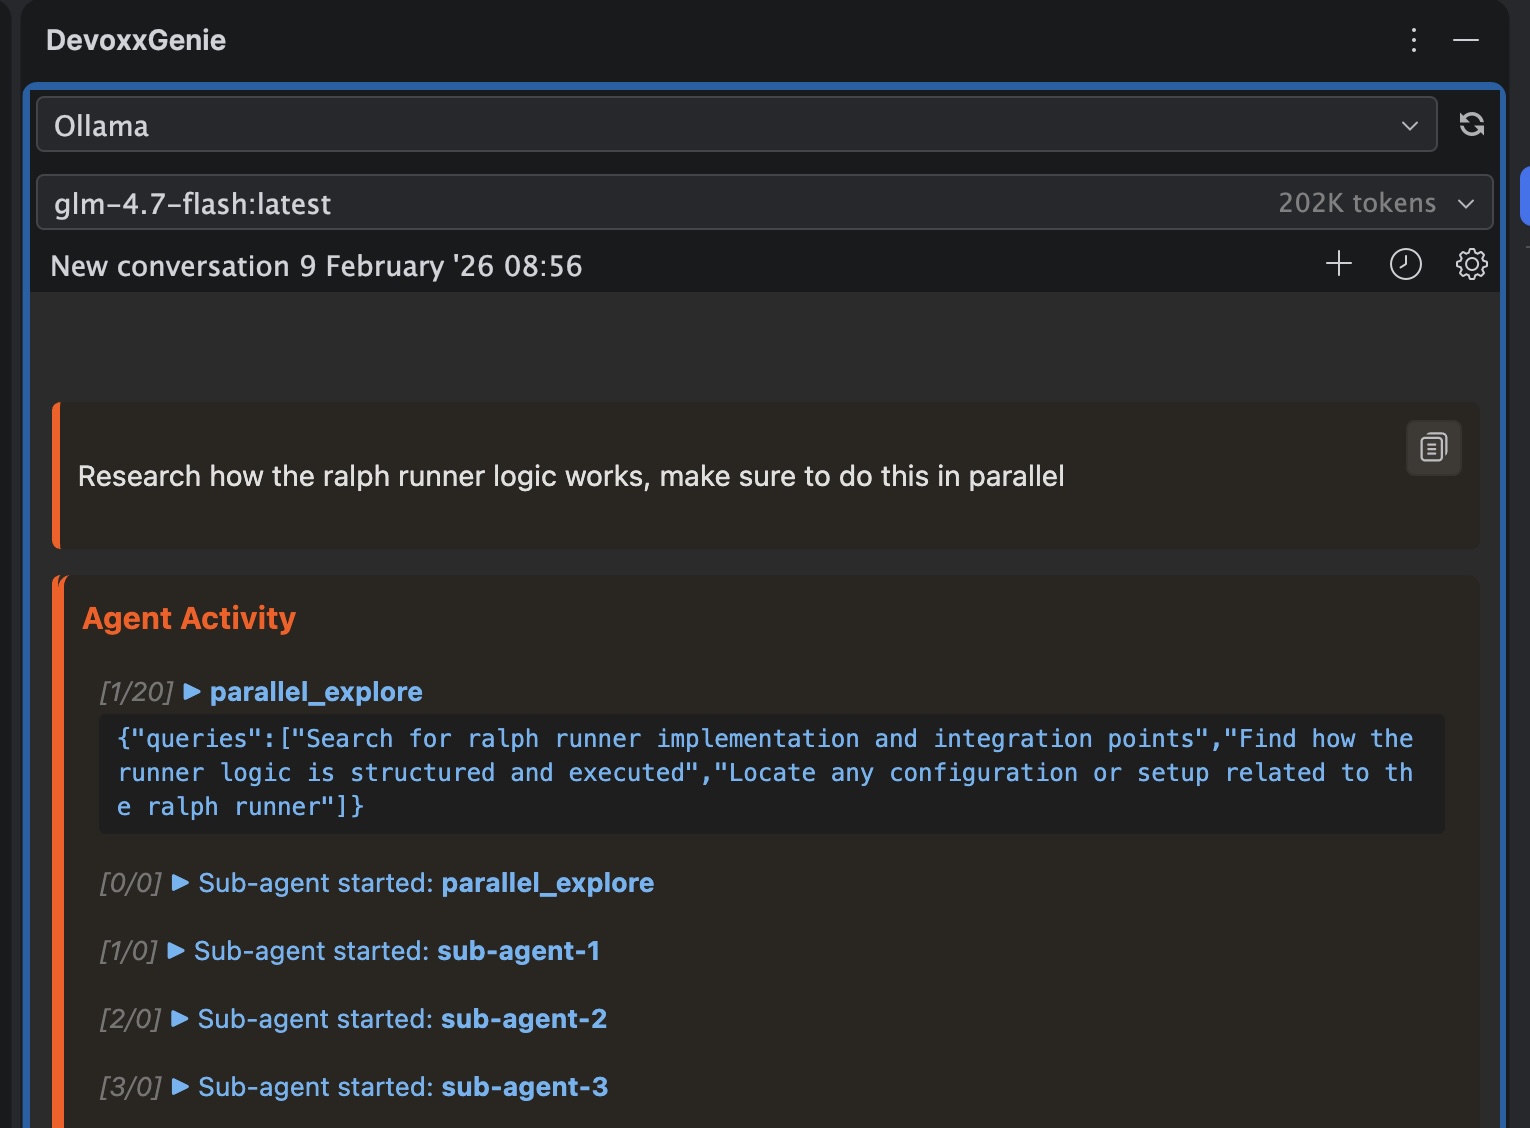
The main agent will spawn parallel sub-agents to investigate different aspects of your codebase, and then synthesize their findings into a unified response:
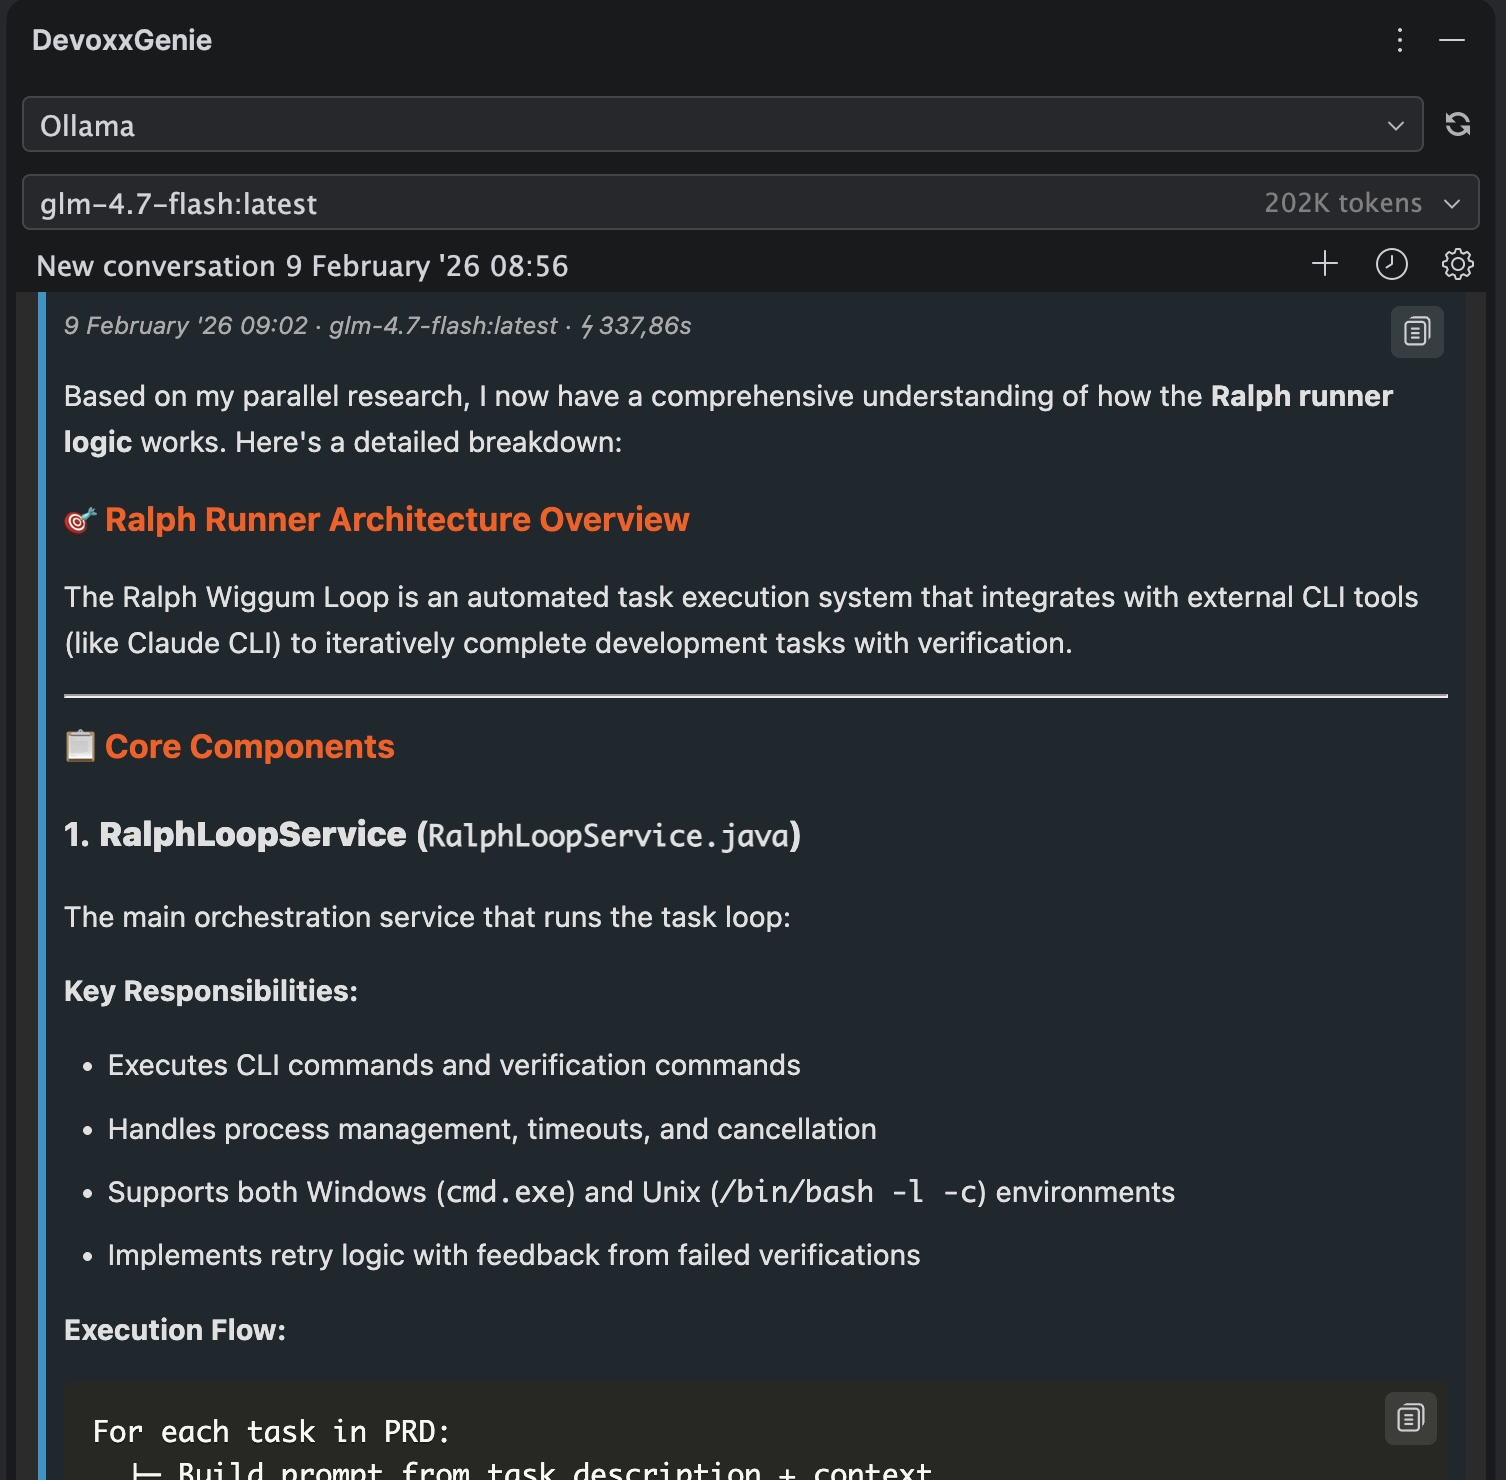
The more specific your exploration queries, the better the results. Asking about multiple distinct topics encourages the LLM to spawn parallel sub-agents rather than investigating sequentially.
Debugging
Agent Log Panel
Open the Agent Log tool window to see real-time activity from both the main agent and all sub-agents. Each log entry shows:
- Counter:
[call#/max]showing progress against the tool call limit - Sub-agent ID:
[sub-agent-1:Provider:model]identifying which sub-agent and its model - Action: What tool was called and with what arguments
You can also copy all logs to clipboard using the toolbar button for sharing or analysis.
WebView Activity
When agents are running, you'll see real-time activity updates in the chat WebView under the "Agent Activity" section, including:
- Agent/sub-agent start/complete/error events
- Individual tool calls
- Color-coded status indicators
Architecture Overview
Single Agent Mode
User Prompt
    |
    v
Main Agent (your configured LLM)
    |
    |--> read_file, write_file, edit_file
    |--> list_files, search_files, run_command
    |--> fetch_page, run_tests
    |--> find_symbols, document_symbols        ← PSI Tools
    |--> find_references, find_definition      ← (Code Intelligence)
    |--> find_implementations                  ←
    |         |
    |         v
    |    Tool Results
    |
    v
Final Response (with context from tools)
Parallel Sub-Agents Mode
User Prompt
    |
    v
Main Agent (your configured LLM)
    |
    |--> parallel_explore(queries: ["query1", "query2", "query3"])
    |         |
    |         |--> Sub-Agent #1 (read_file, list_files, search_files, fetch_page, PSI tools)
    |         |--> Sub-Agent #2 (read_file, list_files, search_files, fetch_page, PSI tools)
    |         |--> Sub-Agent #3 (read_file, list_files, search_files, fetch_page, PSI tools)
    |         |
    |         v
    |    Combined Results (markdown)
    |
    v
Final Response (synthesized by main agent)
Batch Task Execution (Agent Loop)
Agent Mode powers the Agent Loop, which lets you run multiple tasks sequentially in a single batch. Combined with Spec-driven Development, you can define structured task specs and have the agent implement them one after another — with dependency ordering, progress tracking, and automatic advancement to the next task.
Best Practices
- Start with single agent mode: For simple questions, single agent mode is often sufficient and faster
- Use parallel sub-agents for complex exploration: When you need to understand multiple unrelated aspects of your codebase
- Use cheaper models for sub-agents: Sub-agents perform read-only exploration, so smaller models work well
- Leverage PSI tools for refactoring: Before renaming or modifying a method, ask the agent to find all references first — PSI-based search is more reliable than text grep
- Let the agent verify its own changes: With
run_testsenabled, the agent automatically runs tests after code modifications and iterates on failures - Target specific tests: For faster feedback, ask the agent to run a specific test class rather than the full suite
- Set appropriate timeouts: Increase the test timeout for large test suites or integration tests, decrease for quick unit tests
- Be specific in prompts: Mentioning multiple distinct topics encourages parallel exploration
- Monitor tool call limits: If sub-agents hit their limit, increase the max tool calls setting
- Check the Agent Log: If results seem incomplete, the Agent Log shows exactly what was investigated
Troubleshooting
Agent mode not working
- Ensure Agent Mode is enabled in settings
- Check that the model supports tool/function calling
- Try asking questions that require exploration (e.g., "Find all files that...")
Sub-agents not triggering
- Ensure Enable Parallel Explore tool is checked
- Try being more explicit: "Use sub-agents to explore..."
- Ask about multiple distinct topics in one prompt
Sub-agents timing out
- Increase the Sub-agent timeout setting (default: 120s)
- Reduce the scope of exploration queries
- Use a faster model for sub-agents
No model configured
- If you see "No sub-agent model configured", set a default provider in Agent Settings
- Or enable Ollama/OpenAI for auto-detection to work
Tests not running or build system not detected
- Ensure Enable Run Tests tool is checked in Agent Settings
- Verify the project has a recognized build file (
build.gradle,pom.xml,package.json, etc.) in the project root - For non-standard setups, configure a Custom test command in Agent Settings
- On Unix/macOS, if the Gradle wrapper (
gradlew) isn't executable, the tool will automatically usebashto run it
Test execution timing out
- Increase the Test timeout setting (default: 300s)
- Ask the agent to target specific test classes instead of running all tests
- Check that your test suite doesn't have hanging tests or infinite loops
Agent results are incomplete
- Increase Max tool calls or Max tool calls per sub-agent (default: 200)
- Make exploration queries more focused
- Check the Agent Log for errors or limit-reached messages